April-May notes
23 May 2019Some deadlines disturbed the schedule of the monthly notes ; this post is for both April and May.
 A spring 2019 picture.
Cuckoo cycles
A guest post by John Tromp, on the Computational Complexity blog, is about the cuckoo cycle problem.
Basically there are some crypto-currencies, where the proof-of-work consists in finding cycles in a huge graph. This graph is the cuckoo graph, whose edges are defined by the hash function of the cuckoo hashing. The post describes briefly the method used by the miners for this problem.
Interesting to see a theoretical problem tackled in very practical way.
PCP videos
At the end of 2018, a workshop took place in Tel Aviv, about the PCP theorem and related topics. Great news: the talks have been recorded, and the videos are available on a youtube channel.
I watched Ronitt Rubinfield’s talk, and it’s very good. She tells the story of checkers and testers. Just a bit to arouse your interest: like many people, I know interactive proofs for difficult problems (isomorphism, satisfiability etc.), but actually testing and interactive proofs have started with things as simple as GCD.
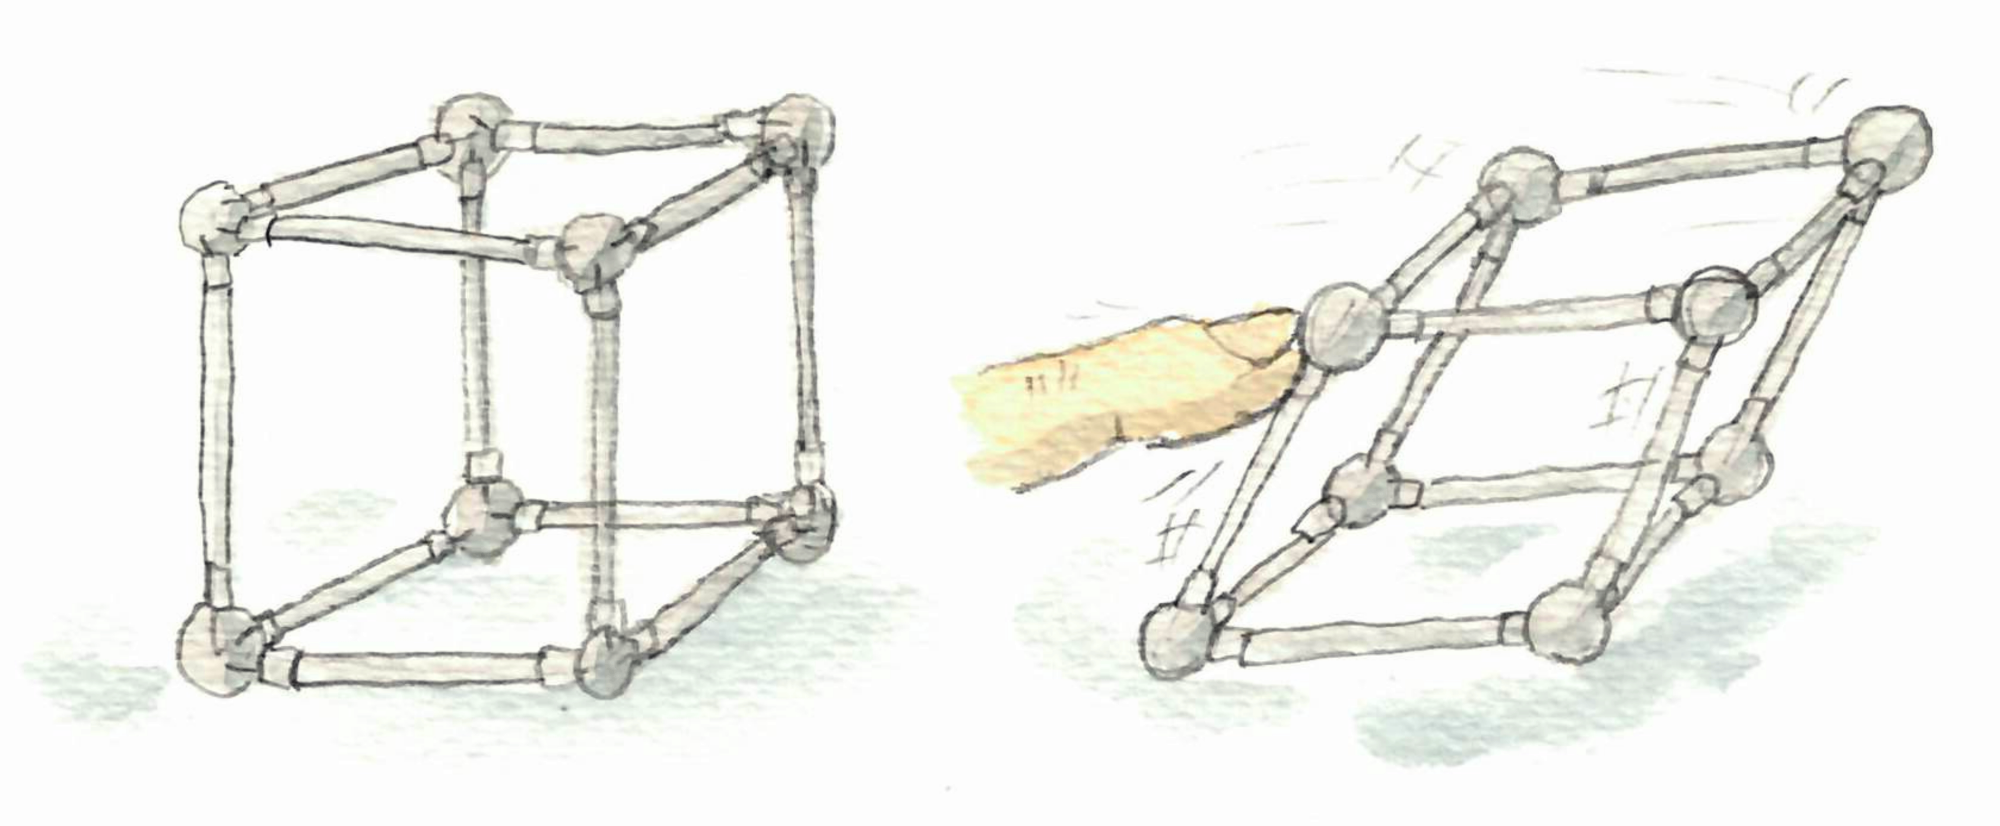
Graphs defined by matchsticks, pennies and hinges.
Here are three types of graphs that have a description in terms of real-world objects.
First, matchstick graphs are graphs that you can draw on a table with matchsticks.
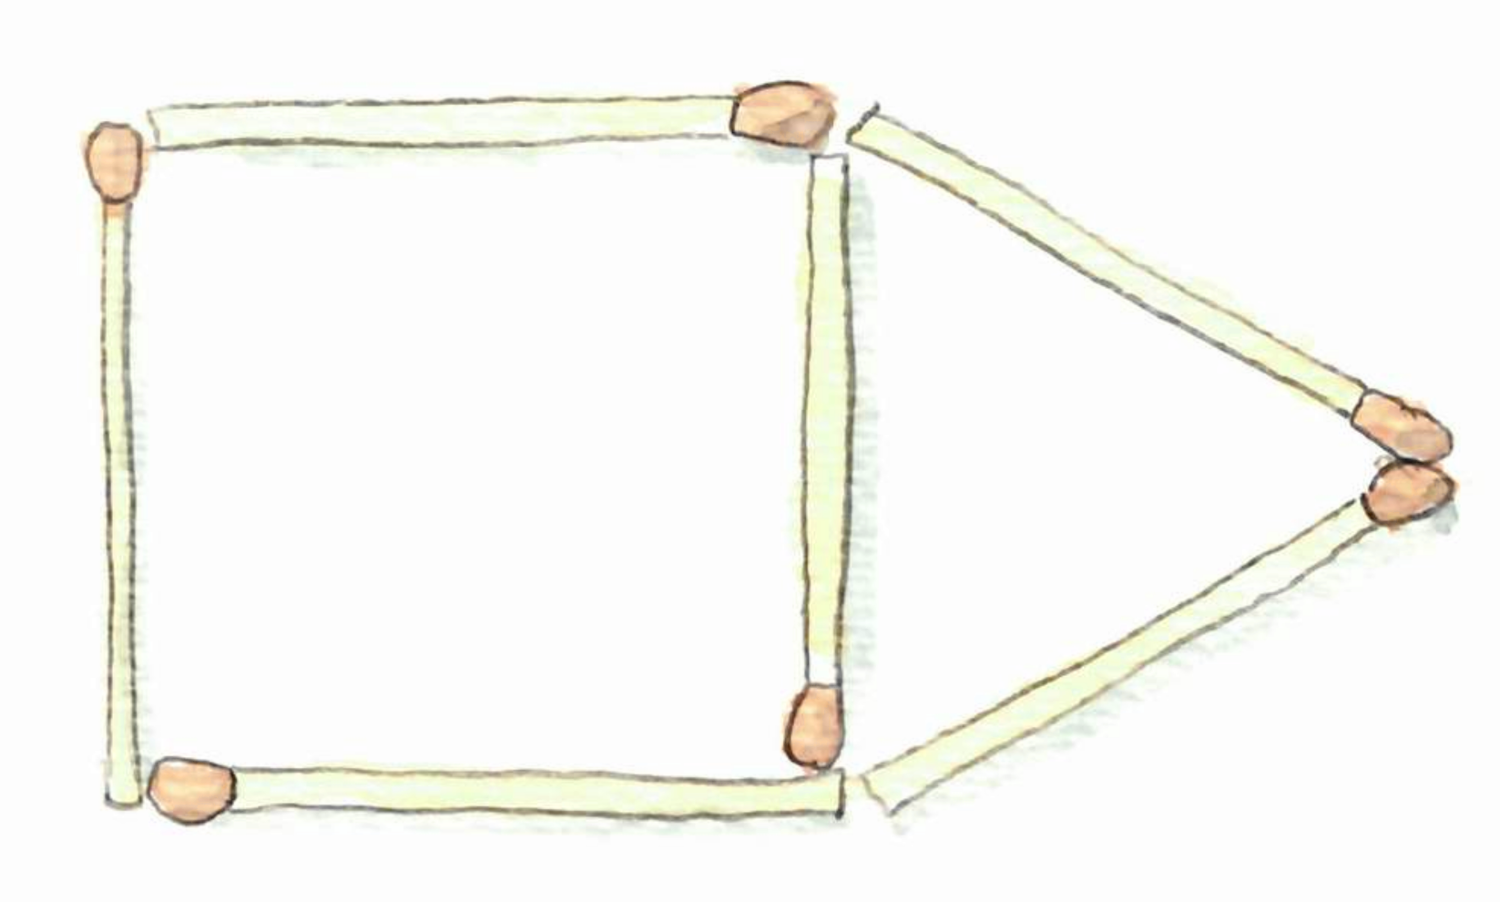
In more precise terms, these are planar unit-distance graphs, that is graphs that you can draw on the plane with only (straight) edges of length 1.
Second, penny graphs are graphs that can be represented by pennies on a table. More precisely, a graph is a penny graph, if it is possible to represent each vertex by a unit disk, and to place the disk in such a way that they touch only at the boundaries, and that each contact represents an edge.
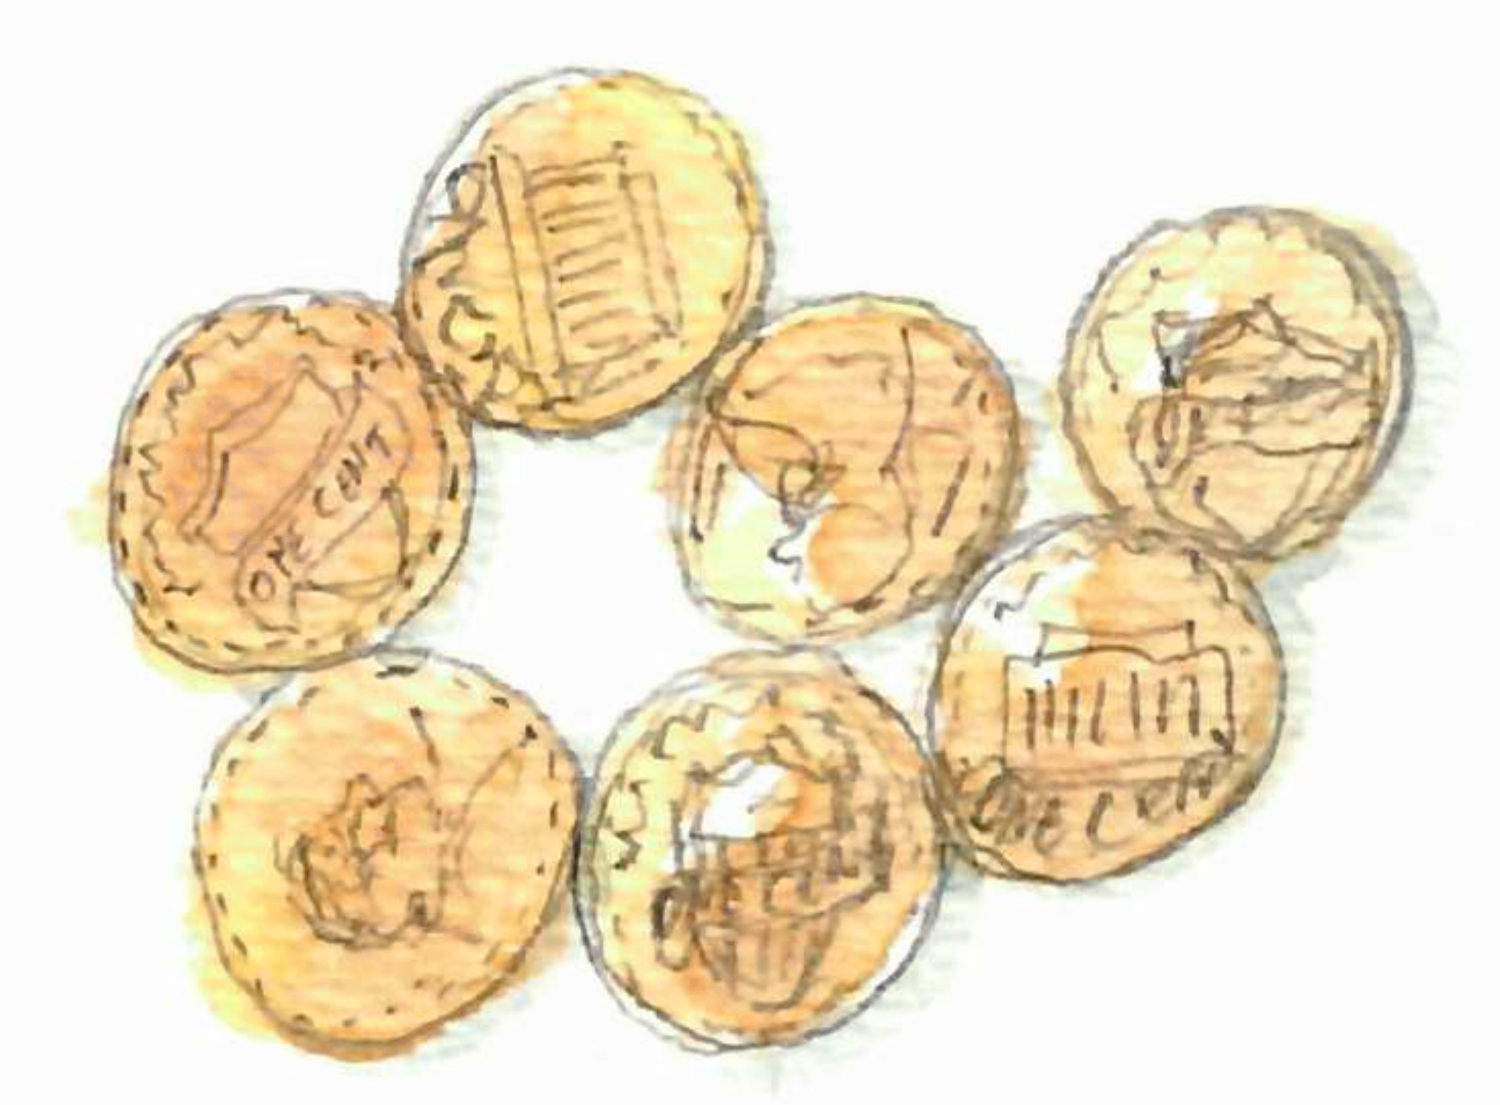
Penny graphs are matchsticks graphs but the reverse is not true.
Finally consider the following experiment. Take a graph, replace edges by rods and nodes by hinges. Now, if when you push on some side, the graph changes shape, then the graph is flexible, otherwise it is rigid. For example a cube is flexible, and a tetrahedron is rigid.
Breaking symmetries, in cells
A common challenge in distributed algorithms is breaking symmetry: if two processors have exactly the same view, they have to take the same step. For example, on a cycle, if the nodes do not have a way to break symmetry (for example unique identifiers), then they all have the same view, thus they take the same steps, and will output the same thing.
Let us now take a look at biology. We know that an essential mechanism in living stuff is cell division, where a cell is basically replaced by two copies of itself. At the very beginning of a new organism, there is one cell, and then it divides again and again, and at the end you get a fully developed living being.
From a distributed computing perspective, int his context, it would be natural to have the exact same cell everywhere, with the same development. It is not the case: brain cells are not muscle cells. Ok, so a first reason it that there is the environment: two identical cells could evolve differently because the things around them are different. In some sense the environment breaks symmetry. But if you think about an embryo, the environment is probably very similar on one side or the other, so at least at the beginning it should be just a heap of identical cells, and it is not the case. So, what’s going on?
A quick look at wikipedia provides the answer: cell division does not produce identical cells. In particular, stem cells divide asymmetrically. The wikipedia article goes quickly into specific things, but from what I understand, that fact that the sperm cell fertilizes the egg cell “in one direction” gives a special direction, that influences the way the small stuff in the cell is distributed. Thus what is inside the cell is not uniformly distributed. This asymmetry is then propagated at the level of the cells. This is because the division of a cell happens in such a way that the two cells have very different small stuff inside (because some proteins make this happen this way).
Discrete analysis and light bulbs
Once in while I remember that the Discrete Analysis journal exists. It is one of these few journals that are really open access, in the sense of the Free journal network. One can check the list of free journals here. The relevant journals for complexity/algorithms/graphs are DMTCS, JoCG, JGAA, LMCS, TAG, and ToC.
Discrete analysis is mainly about analytic methods in combinatorics, thus not exactly my cup of tea, but I know it from the blog of Timothy Gowers. And once in a while, there is a paper that arouses my curiosity.
The website is especially well-done for readers like me. Unlike usual journals with ugly websites, and just a list of papers, Discrete Analysis has a nice picture for each paper, a small page describing it, with an introduction written by a member of the editorial board. All this is very nice, although at first sight it may look a bit too flashy.
A paper that “makes the cover” of the website these days is Fixed-energy harmonic functions. In addition to the introduction, there is the video of a talk about the paper. It goes quickly into maths that I can’t understand without effort, but the first five minutes explain the problem in a fun fashion. Consider an electric circuit with light bulbs. The circuit is represented by a graph and every edge has a weight: the resistance of the light bulb of this section of the circuit. Now you can plug the wires of a battery at two arbitrary nodes of the graph and ask for the energy dissipated on each bulb, that is for the brightness of each bulb. This is a classic exercise in physics, and on reasonable circuits one just has to use simple laws of electricity and a lot of time. For example the video features this circuit, where all the resistances are equal.
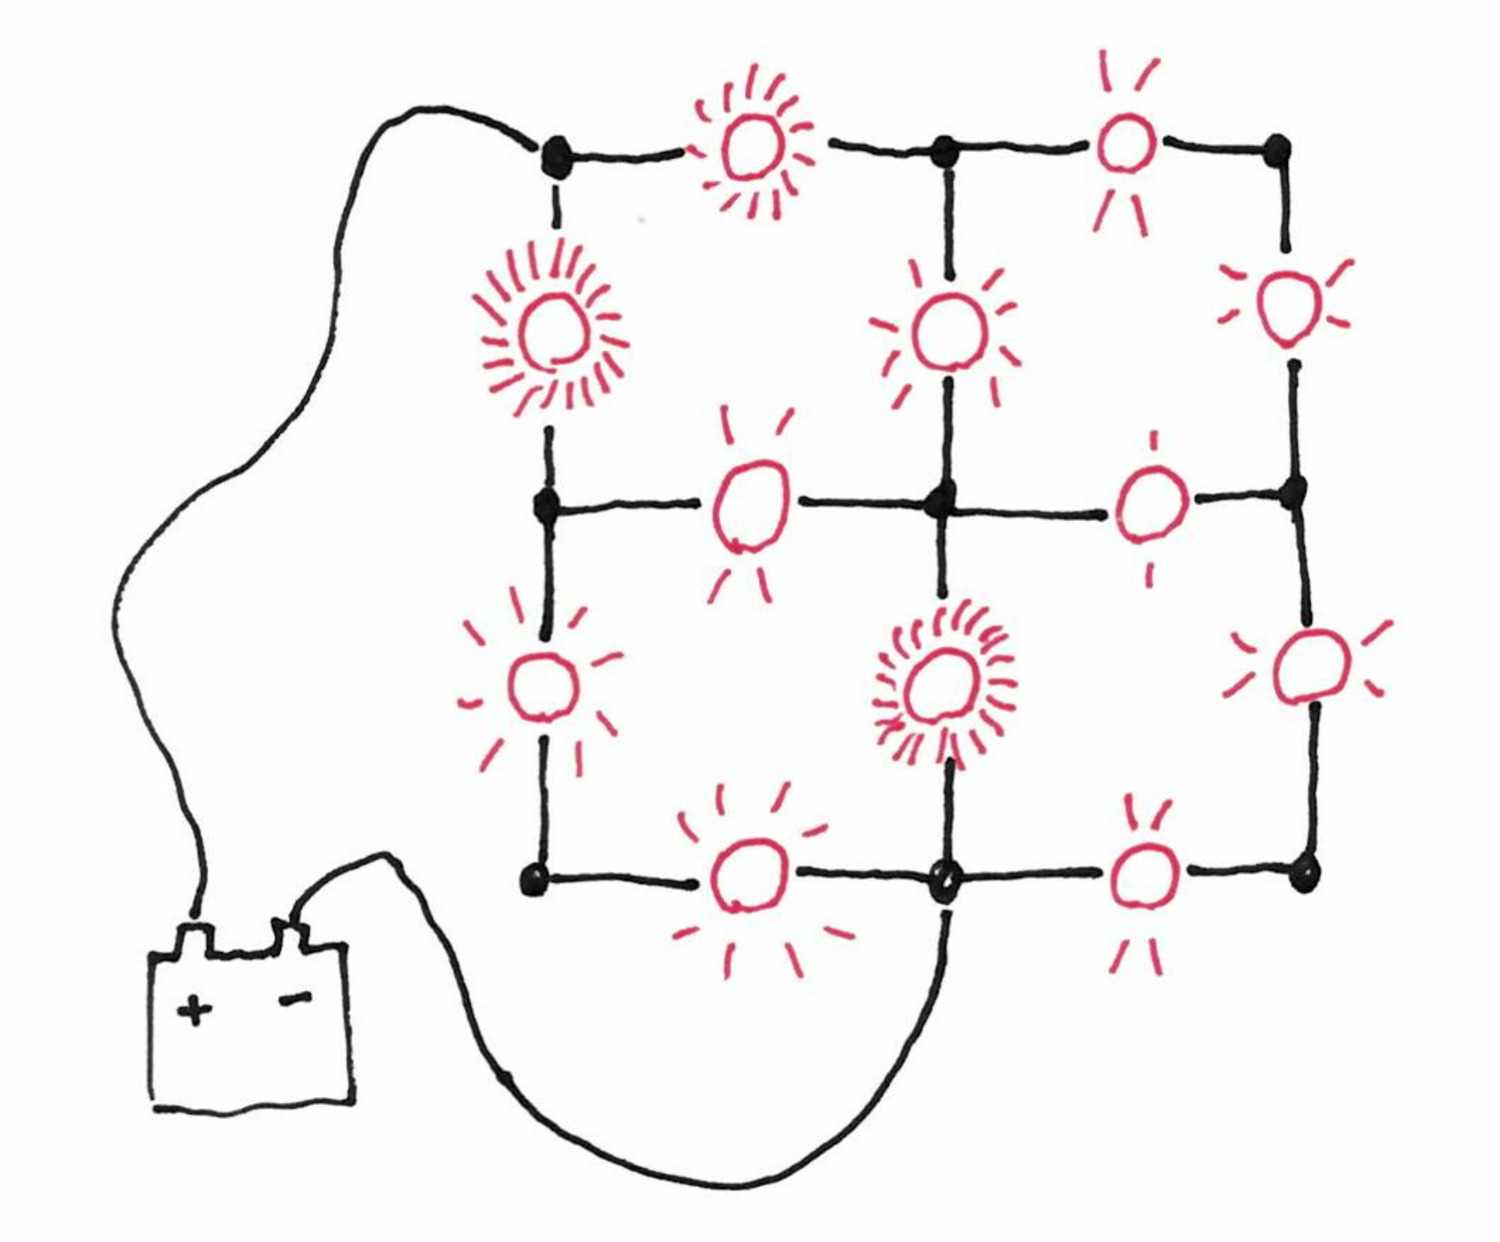
The paper studies the reverse problem: given a graph, and two nodes to plug the battery, how to choose the resistance of the light bulbs such that they all shine with the same brightness?
Pie rule
In the March notes, I mentioned some criteria for fair item assignment. One is well-known: the first player defines two bundles of items, the second player choose the bundle it prefers. This way the first player will design the bundles in the most balanced way. A more concrete setting is with a pie (hance the name of “pie rule”): the first player cuts the cake into two pieces, and the second player chooses the slice.
I discovered that something similar exists for games such as chess, go, etc. In some of these two-players games, the first player has a great advantage. To mitigate this, one can use the pie rule. Let say that we consider chess, and that A plays white, and B plays black. Then the pie rule says that after A has played the first move, B has the choice between:
- playing the normal way until the end
- changing the color, that is taking the white side, and letting A do the first move for the black, and then playing the normal way until the end (with A playing black, and B playing white).
This way, A has an incentive to make a not-too-good move to start, which mitigates its first-player advantage.
Multiplicative weight update
The multiplicative weight update method is a general algorithmic method, that is not known enough, and that has been discovered several times in several contexts. The basic description is the following. Suppose you have several experts, that give you advice for a series of decisions that you take one by one. After each decision, you redesign the way you aggregate the advice to take a decision. Typically you want to give more weight to experts that have given good advice. The multiplicative weight update method basically states that updating the weight in multiplicative manner is a good idea. It seems pretty specific but it is actually very general.
In addition to the wikipedia page and the references therein (including a survey by Arora, Hazan and Kale), you may want to take a look at a series of post that Luca Trevisan is currently writing on this topic. Actually he is mostly interested in the developments of this method that have been used in a variety of papers in complexity recently. The series of posts starts here.
Jeremy Kun also has a nice post about the method.
Maximum matchings that are not perfect
I recently had to think about graphs that do not have a perfect matching. The first example is of course graphs with an odd number of vertices. Next, you can find things like the one below (with a maximum non-perfect matching).
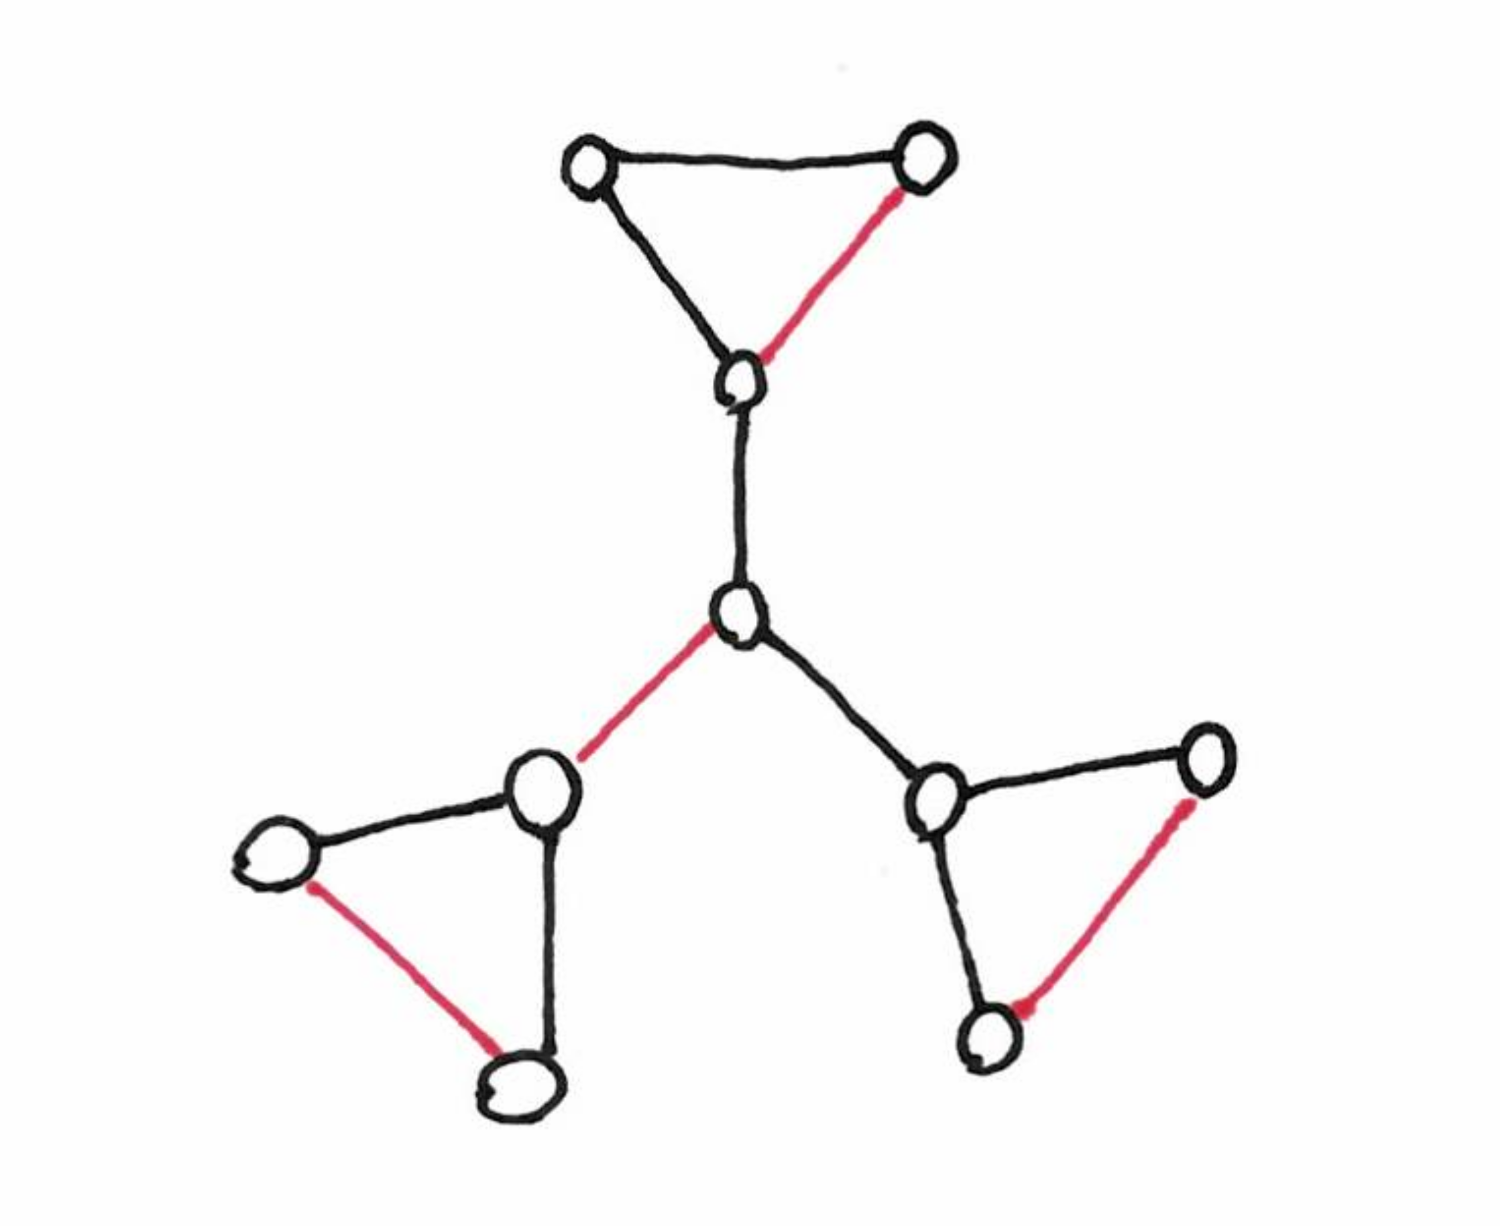
Intuitively, in each triangle, one node must be matched with a node outside the triangle, but the three triangles are looking for the same node in the middle, and as only one can be served, the other triangles must have an unmatched node. Actually, even a star with three leaves is a good example.
Remember Tutte theorem: A graph, $G = (V, E)$, has a perfect matching if and only if for every subset $U$ of $V$, the subgraph induced by $V − U$ has at most $|U|$ connected components with an odd number of vertices (definition from wikipedia). In the drawing above, take the middle node as $U$, you get three connected component with an odd number of vertices. As $3>1$, this graph doesn’t have perfect matching.
Tutte theorem is actually a special case of the Tutte–Berge formula, which states that the size of the maximum matching is: $\frac{1}{2} \min_{U\subseteq V} \left(|U|-\operatorname{odd}(G-U)+|V|\right)$
where $\operatorname{odd}$ counts the number of odd connected components.
Irreproducibility and unpublished failures
A paper in Nature identifies the “four horsemen of irreproducibility” that harm science. One of them is the publication bias: studies that do not conclude that there is a relation between two things are not publishable. Two problems with this are: (1) researchers have an incentive to find correlations, when they should have an incentive to find the truth, and (2) if because of statistics a false correlation can appear in 5% of the experiments, then only the wrong conclusion will be made public (after 19 teams on average have tried, and failed to find a correlation).
There are efforts to fight this problem. One is the notion of registered report. This consists in having the journal to review an experiment (the topic, the hypothesis tested, the method), before the experiment is made. If this set-up is accepted, then the experiment is made, the paper written and it goes through a second review. The paper is provisionally accepted after the first review.
In TCS and maths in general, this publication bias is not a central problem, as one can check the proofs, and hopefully be convinced that the papers published are correct. Nevertheless, we probably loose a lot of time trying the same approaches on the same problems, without making our failures public.
Planes etc.
As a follow-up to the note of last month about conference travel and its environmental impact, here are a few more elements.
An article (in French) about flights of researchers, mentions several alternatives. One is to have purely virtual conferences (such as this one). Another one is to have the conference distributed among multiple sites, for example one in each continent. Probably worth testing… By the way, remember that we can already enjoy a virtual TCS seminar: TCS+.
Also, it’s difficult to make efforts when you are almost alone to make them and that it even hurts you career. Maybe a charter or a code of conduct, for researchers of an institution or of a community would help. For example an important Danish newpaper now has such a charter (no domestic flights (remember it’s Danemark), less flying in general, less advertising for far away destination etc.). I couldn’t find good press coverage of this in English, but here is an article in the main French newspaper.
EDIT(July 2019): there actually exists some rules in some universities, see this Wired article.